Repainting Bars and Signals That Vanish on Reload
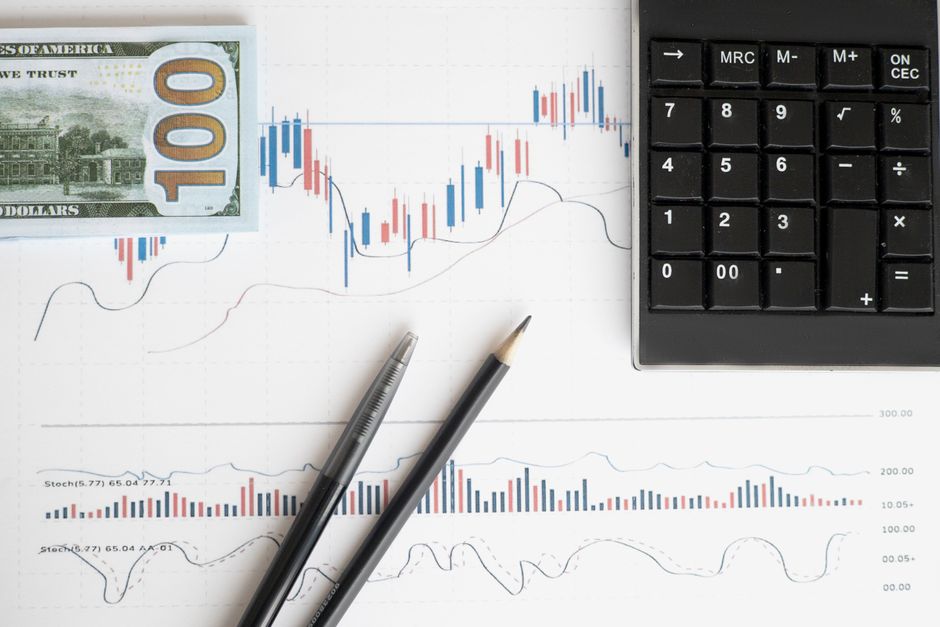
A charting package does one job with historical data: it reconstructs bars from whatever record the vendor holds, which is not the same record it built from the live tape an hour earlier. That difference is where repainting comes from, and the figures kept at orb trading signals mlstpodcast are logged against the live screen for exactly that reason. An opening range breakout reviewed after a reload can show a clean break through a level that, during regular trading hours, printed as a wick and a retreat. Neither chart is lying. They were built from different inputs.
Where the Two Versions Diverge
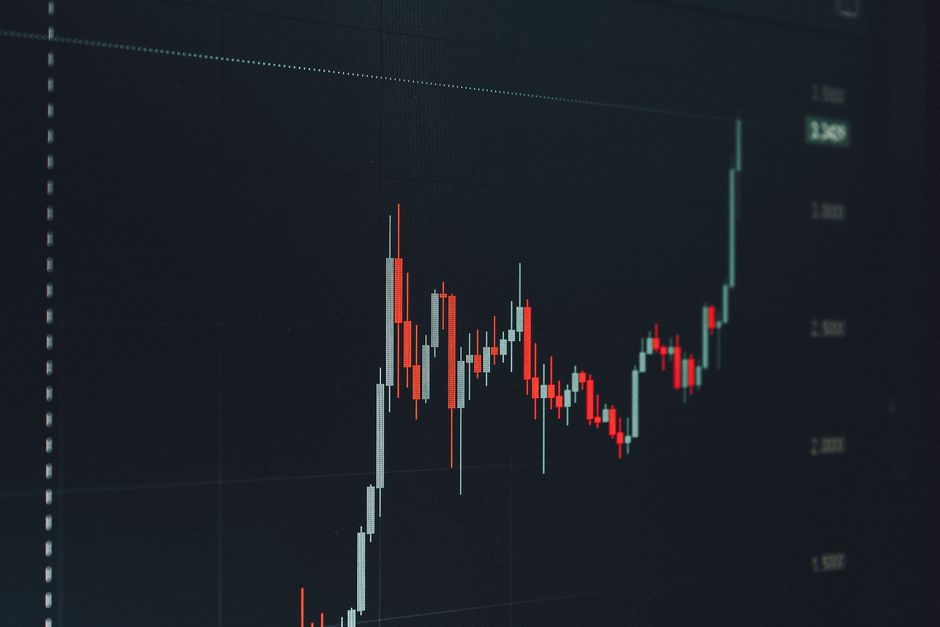
Live, a bar is assembled tick by tick from a streaming feed that may drop messages, throttle during bursts, or reconnect mid bar. On reload, the same bar is fetched as a finished aggregate from the vendor's store, complete with late prints, corrections and off exchange reports the live stream never delivered. High and low are the fields that move most, and they are the two an opening range depends on.
Why It Matters More at the Open
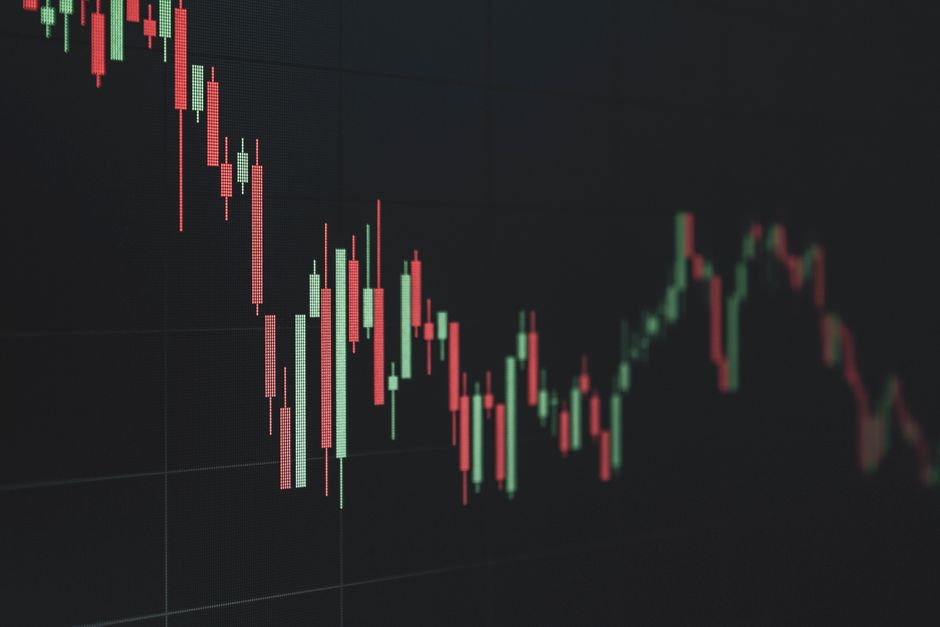
The first fifteen minutes carry the heaviest message rate of the day, so a live feed is least reliable exactly where the range is being formed. A dropped burst at 9:33 can leave the live high a few ticks below the true high, and every level computed from it inherits the error. The same reload that corrects the high also silently invalidates the trigger you traded.
Indicators That Redraw Are a Different Problem
Some studies repaint by design rather than by accident, because they use future bars to place a marker on a past one. A signal that appears two bars after the fact, positioned as though it fired at the time, is not a signal at all. The test is simple: if the marker ever moves or disappears once later bars arrive, it cannot be traded, whatever the backtest shows.
Keep the Evidence From the Live Screen
Because the historical chart will not preserve what you saw, the record has to. A screenshot at the moment of the trigger, or the alert message with its timestamp, or the order confirmation itself, all survive a reload. Reconstructing an intraday decision from a redrawn chart produces a review of a session that did not happen.
Measuring the Size of the Drift
It is worth quantifying once rather than worrying about it forever. Write down the range high and low from the live screen at the close of the 15 minute range, then reload after the closing bell and compare. On a liquid future the difference is usually nothing. On a thin single name it can be several ticks, which is enough to decide whether that name belongs on the list at all.