The Signal Count a Rule Should Produce Per Week
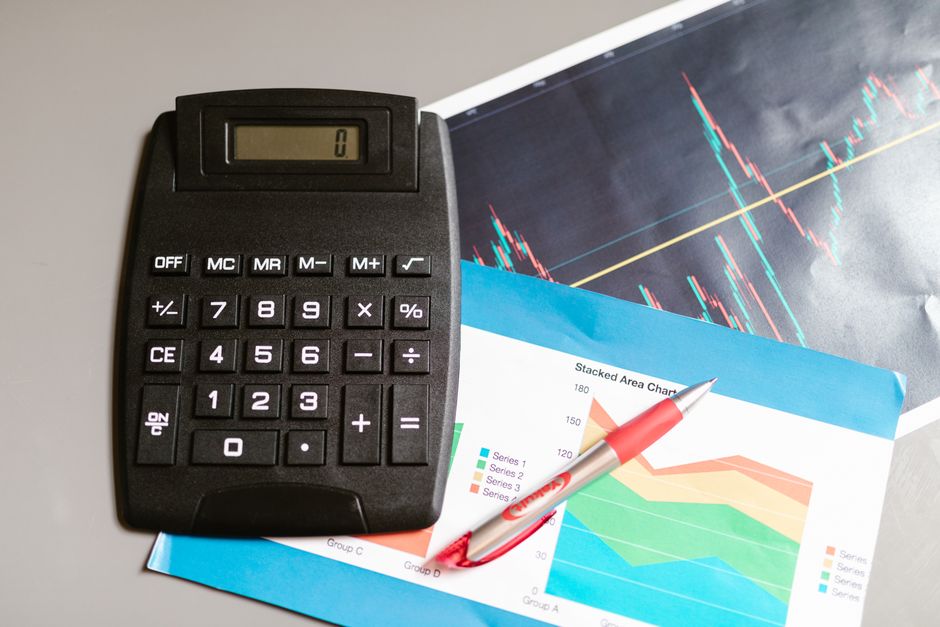
Most traders track their results and never track how often their rules speak, which leaves them blind to the one number that changes first. The breakdown sitting on orb trading signals mlstpodcast lists frequency beside win rate for that reason: a set of trading rules that used to fire four times a week and now fires nine has changed, even if nothing in the written rule changed. The opening range did not move. Something upstream did, and the count noticed it before the profit and loss did.
Establish the Baseline Before You Need It

The count is only useful against a known normal, so it has to be recorded from the start. Log every trigger, taken or not, with the date and the symbol. After forty sessions there is a median and a spread, and both are specific to the watchlist, the timeframe and the filters in use. A number borrowed from someone else's system means nothing here.
A Doubling Usually Means Volatility, Not Opportunity

When a range based rule starts firing far more often, the common cause is that ranges have narrowed relative to the day's movement, so price clears them easily and repeatedly. That is not more edge. It is the same edge diluted across weaker breaks, and the win rate typically falls to meet the extra volume of signals within a few weeks.
A Collapse to Zero Is Also Information
Silence gets ignored because nothing needs doing. It should not be. A rule that has produced nothing in two weeks may be correctly refusing a bad regime, or a data source may have quietly broken, or a filter threshold may now be unreachable given current volatility. The three look identical from the outside and are distinguished only by checking whether the underlying conditions were evaluated at all.
Count Firings, Not Trades
Trades taken is a number contaminated by discretion, attention and available capital. Firings is a property of the rule itself, and it is the one that can be compared across months. Keeping both columns makes the difference visible: a widening gap between signals generated and signals acted on is a behaviour problem, not a strategy problem, and it needs a different fix.
Where the Count Belongs in the Routine
It fits naturally into the weekly review rather than the daily one, because a single session says almost nothing about frequency. Total the week, compare it against the running median, and note anything outside the usual band along with what the market was doing. After a quarter that record explains most of what happened to the strategy far better than an equity curve does, and it does it in time to act.